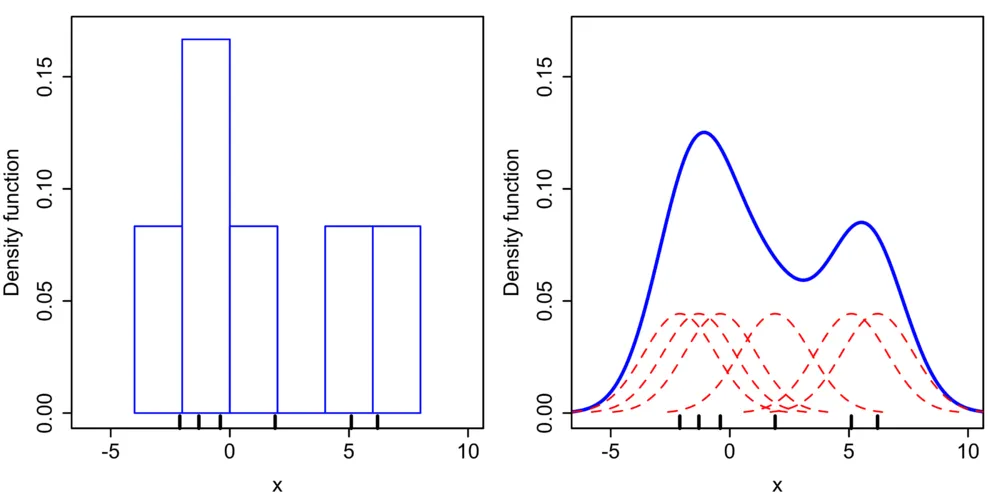
Comparison of the histogram (left) and kernel density estimate (right) constructed using the same data. The six individual kernels are the red dashed curves, the kernel density estimate the blue curves. The data points are the rug plot on the horizontal axis.